The Story
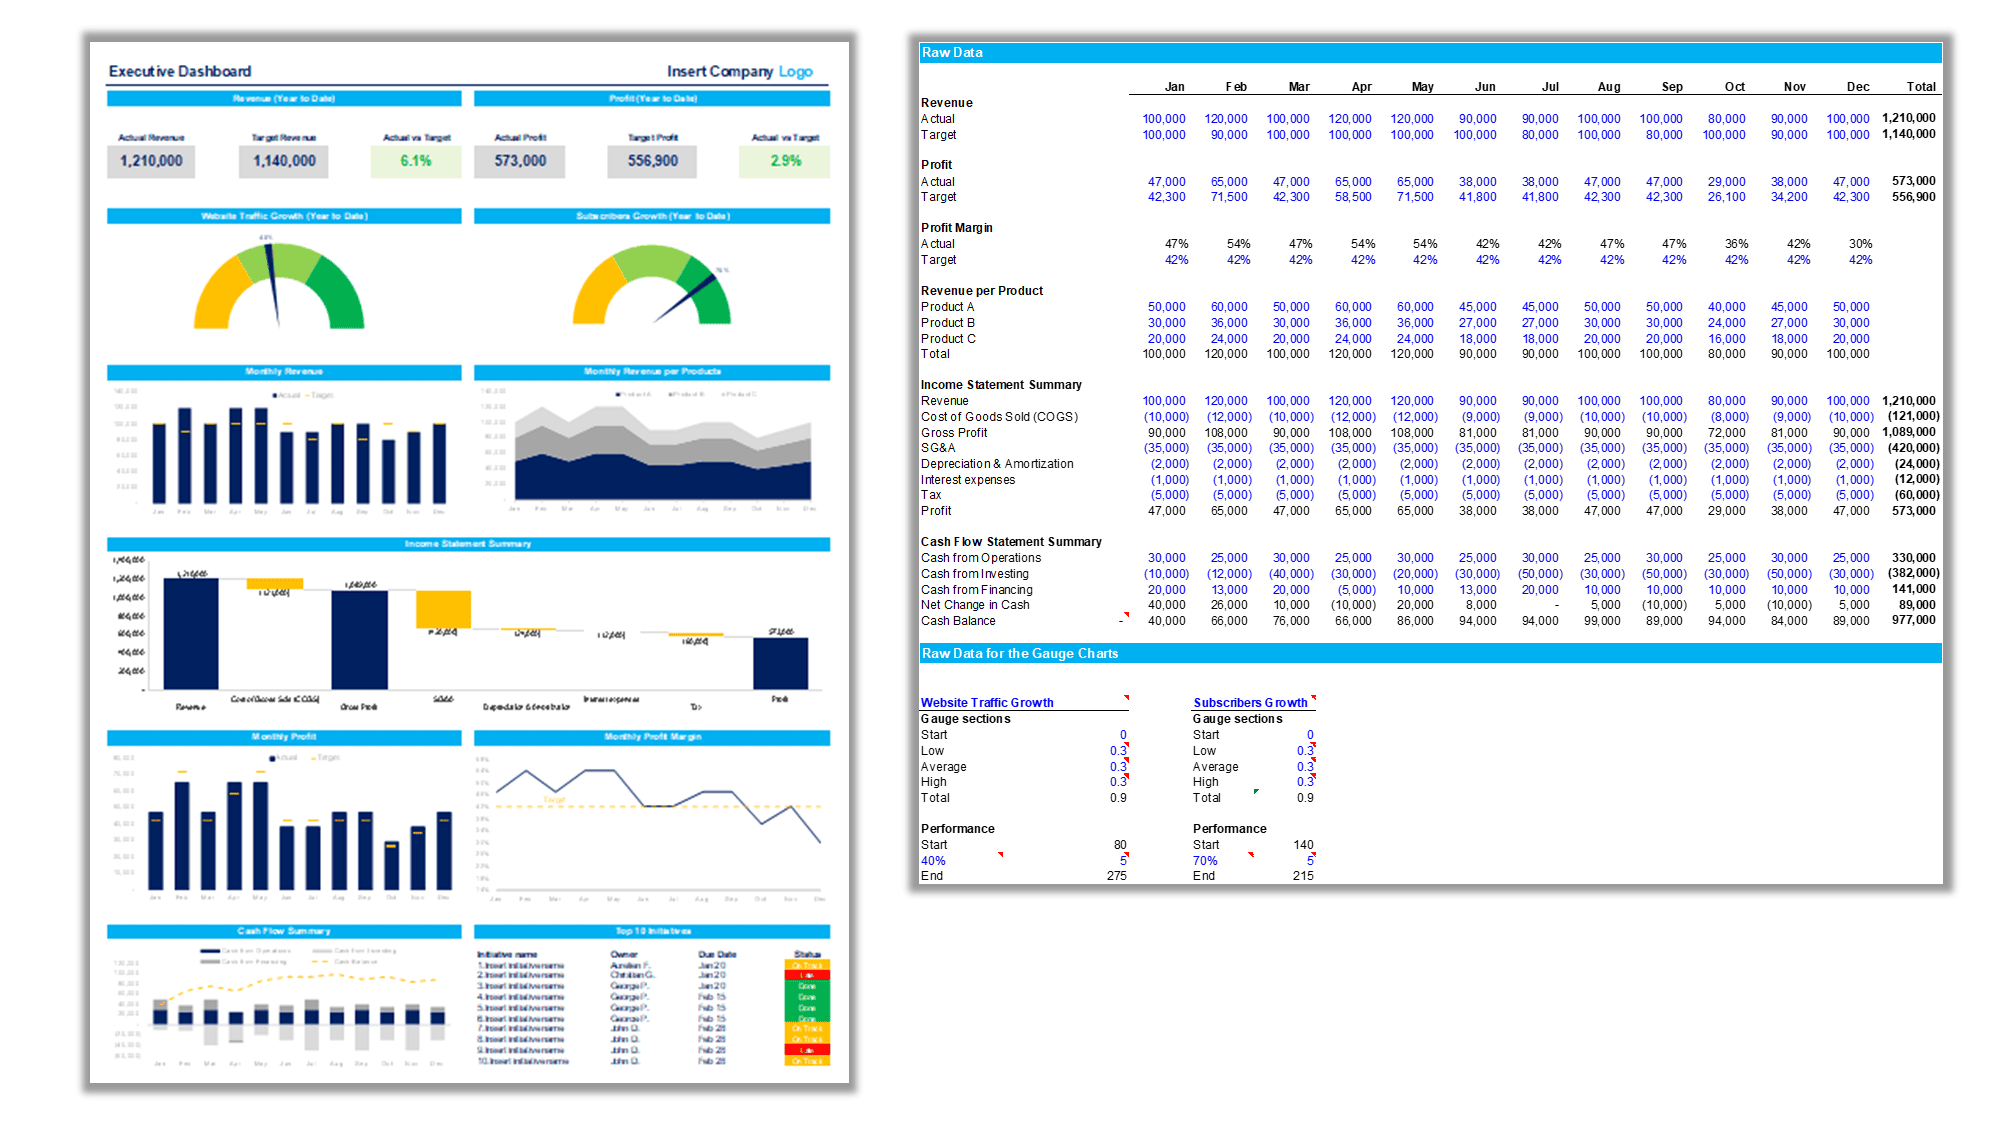
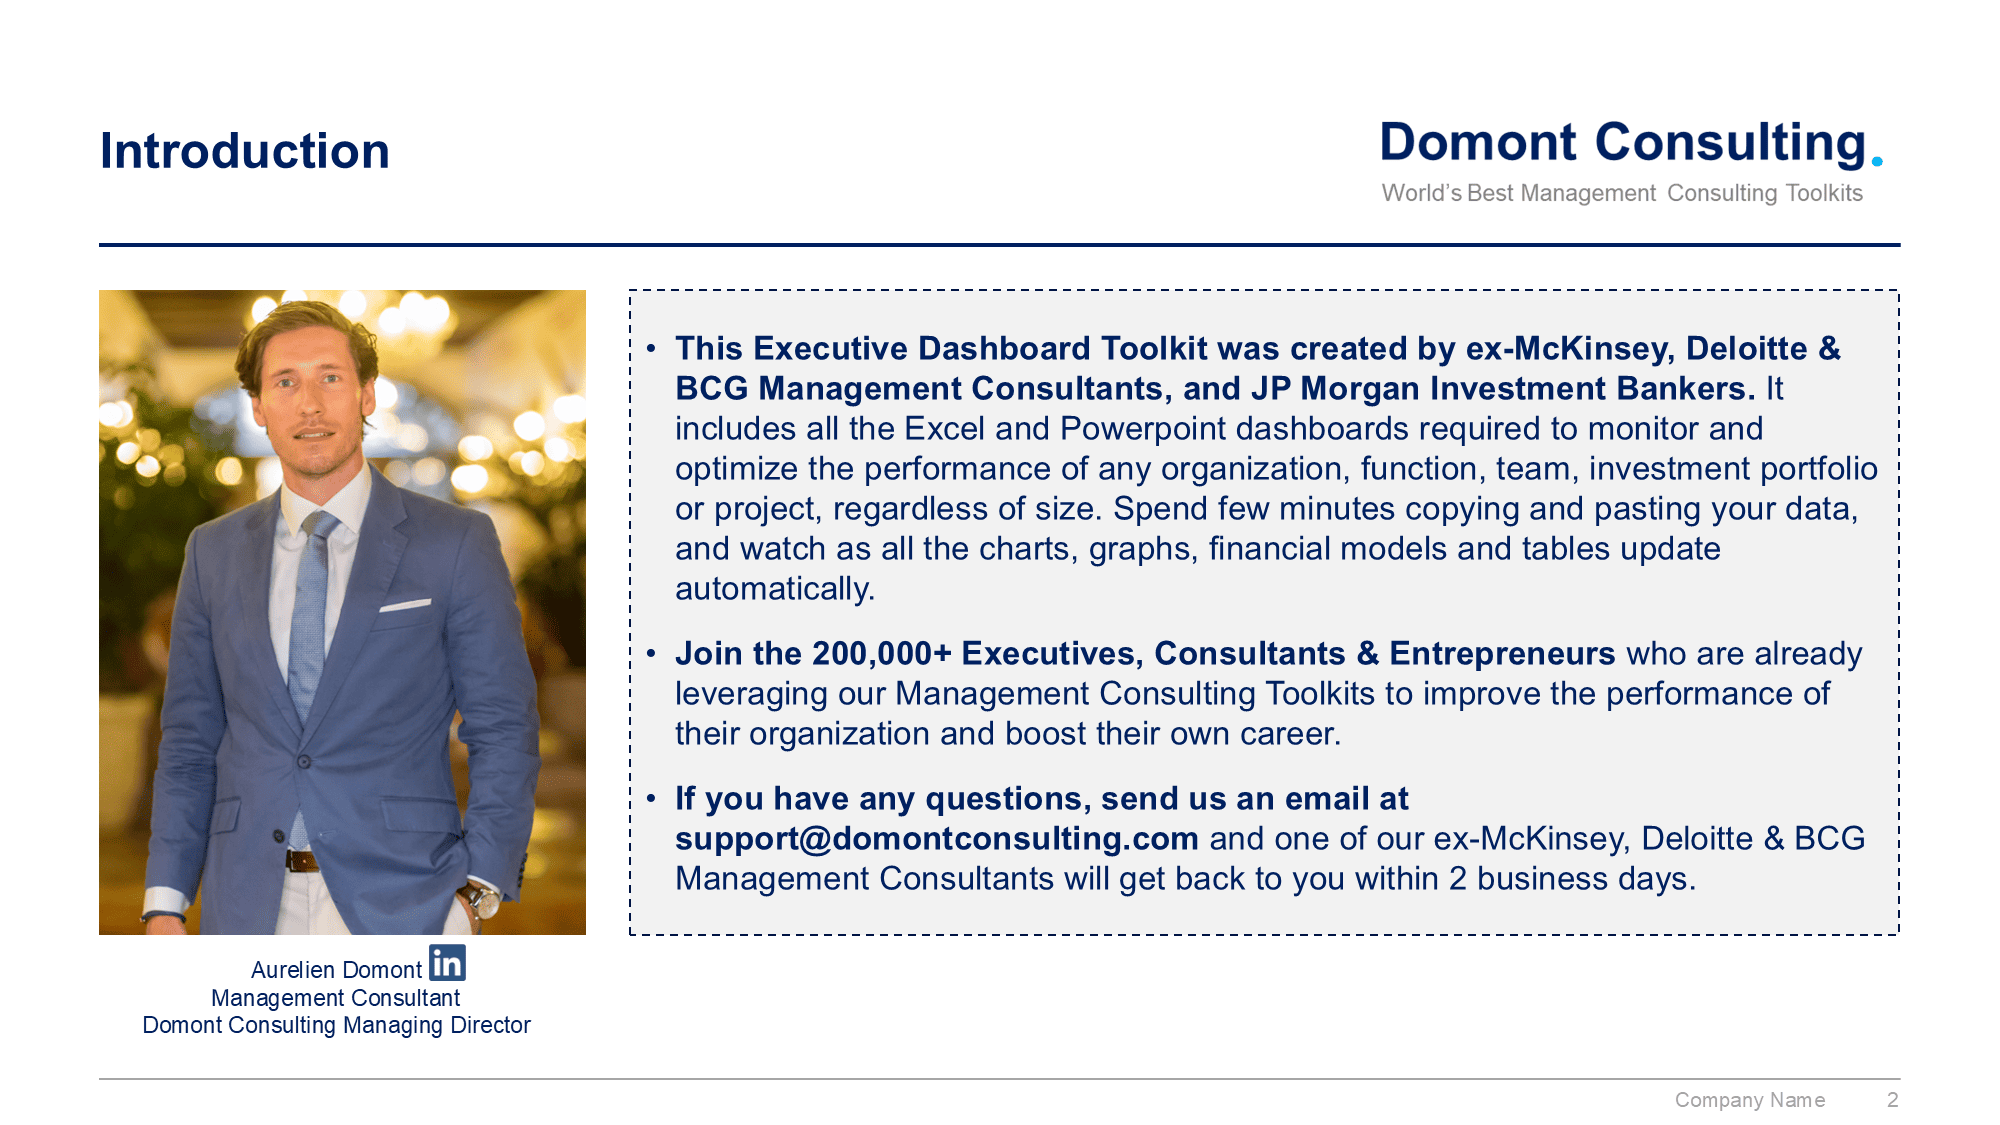
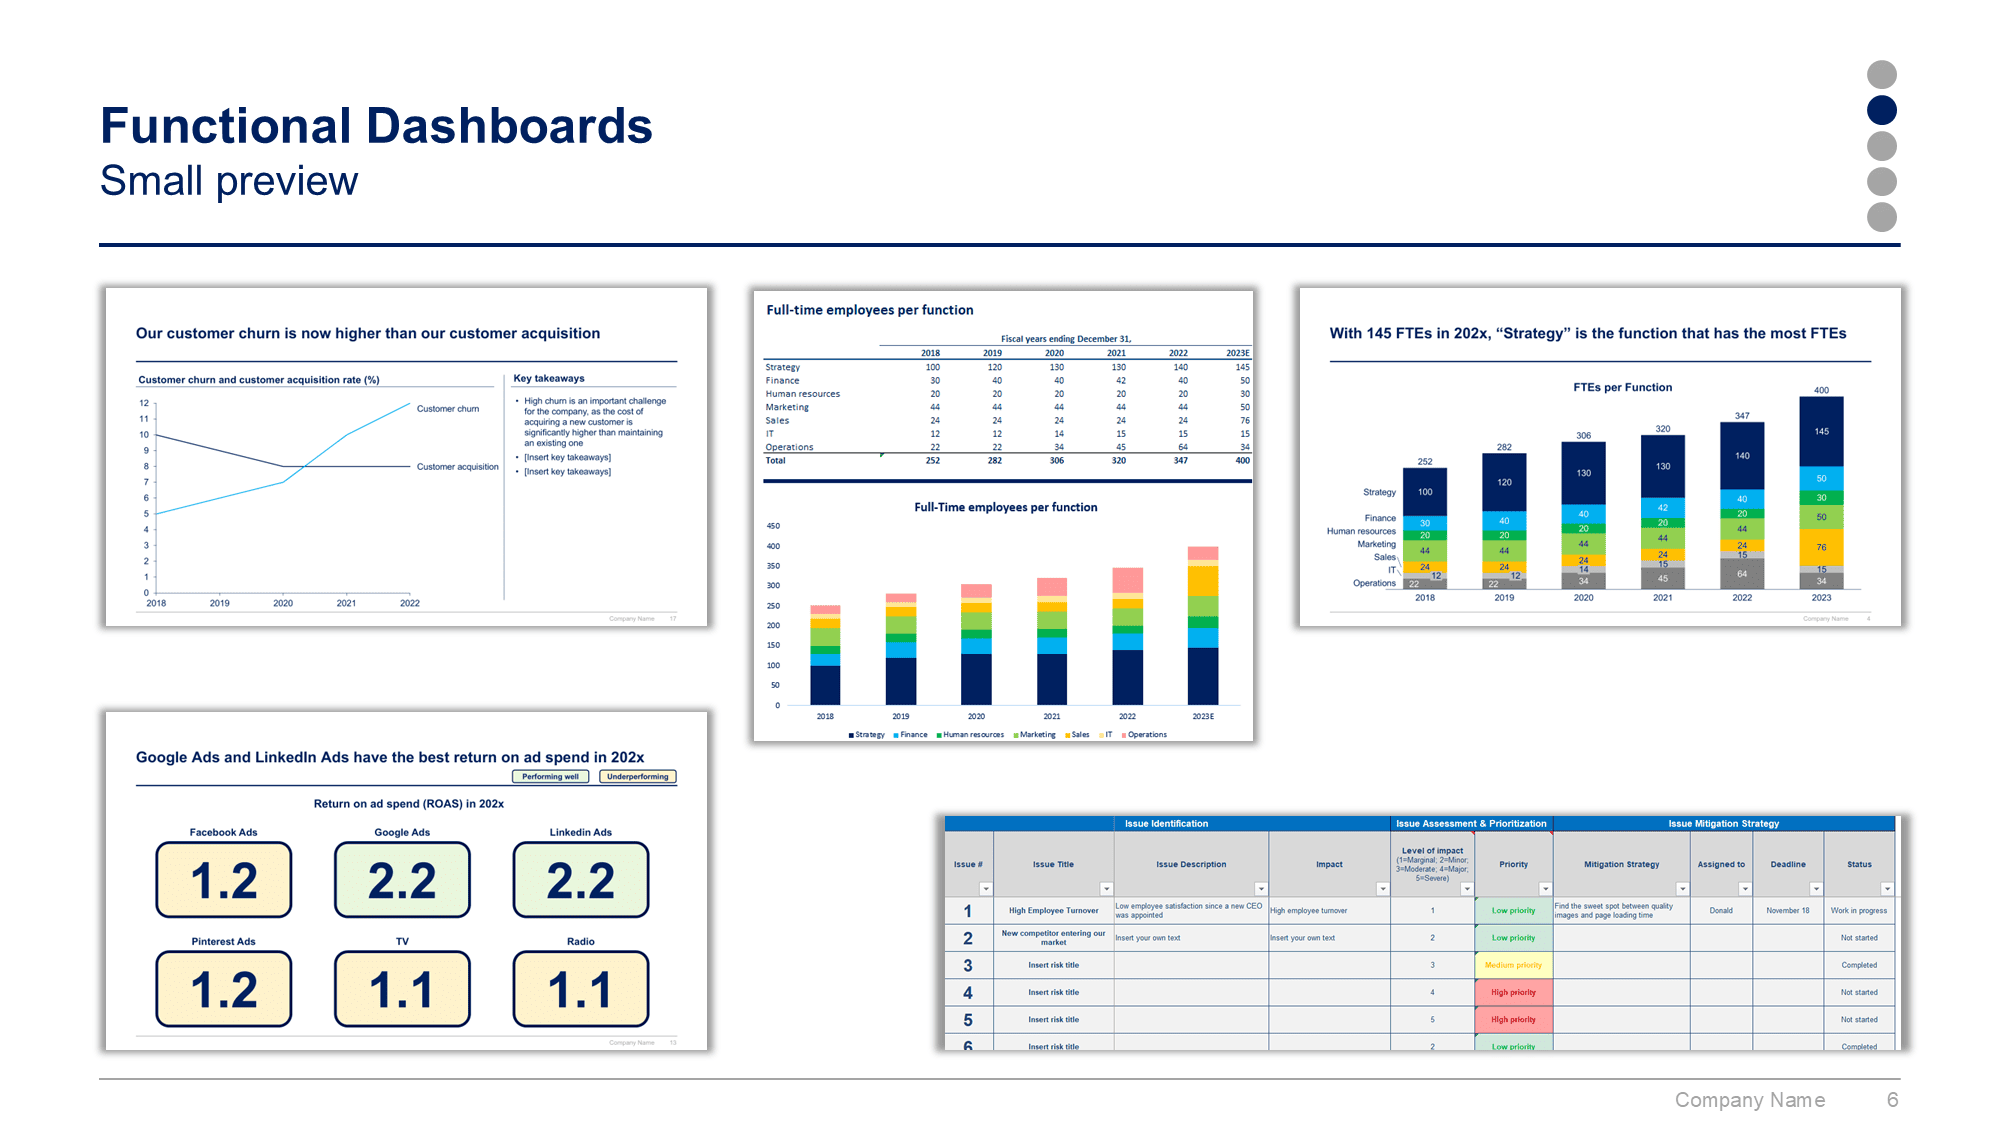
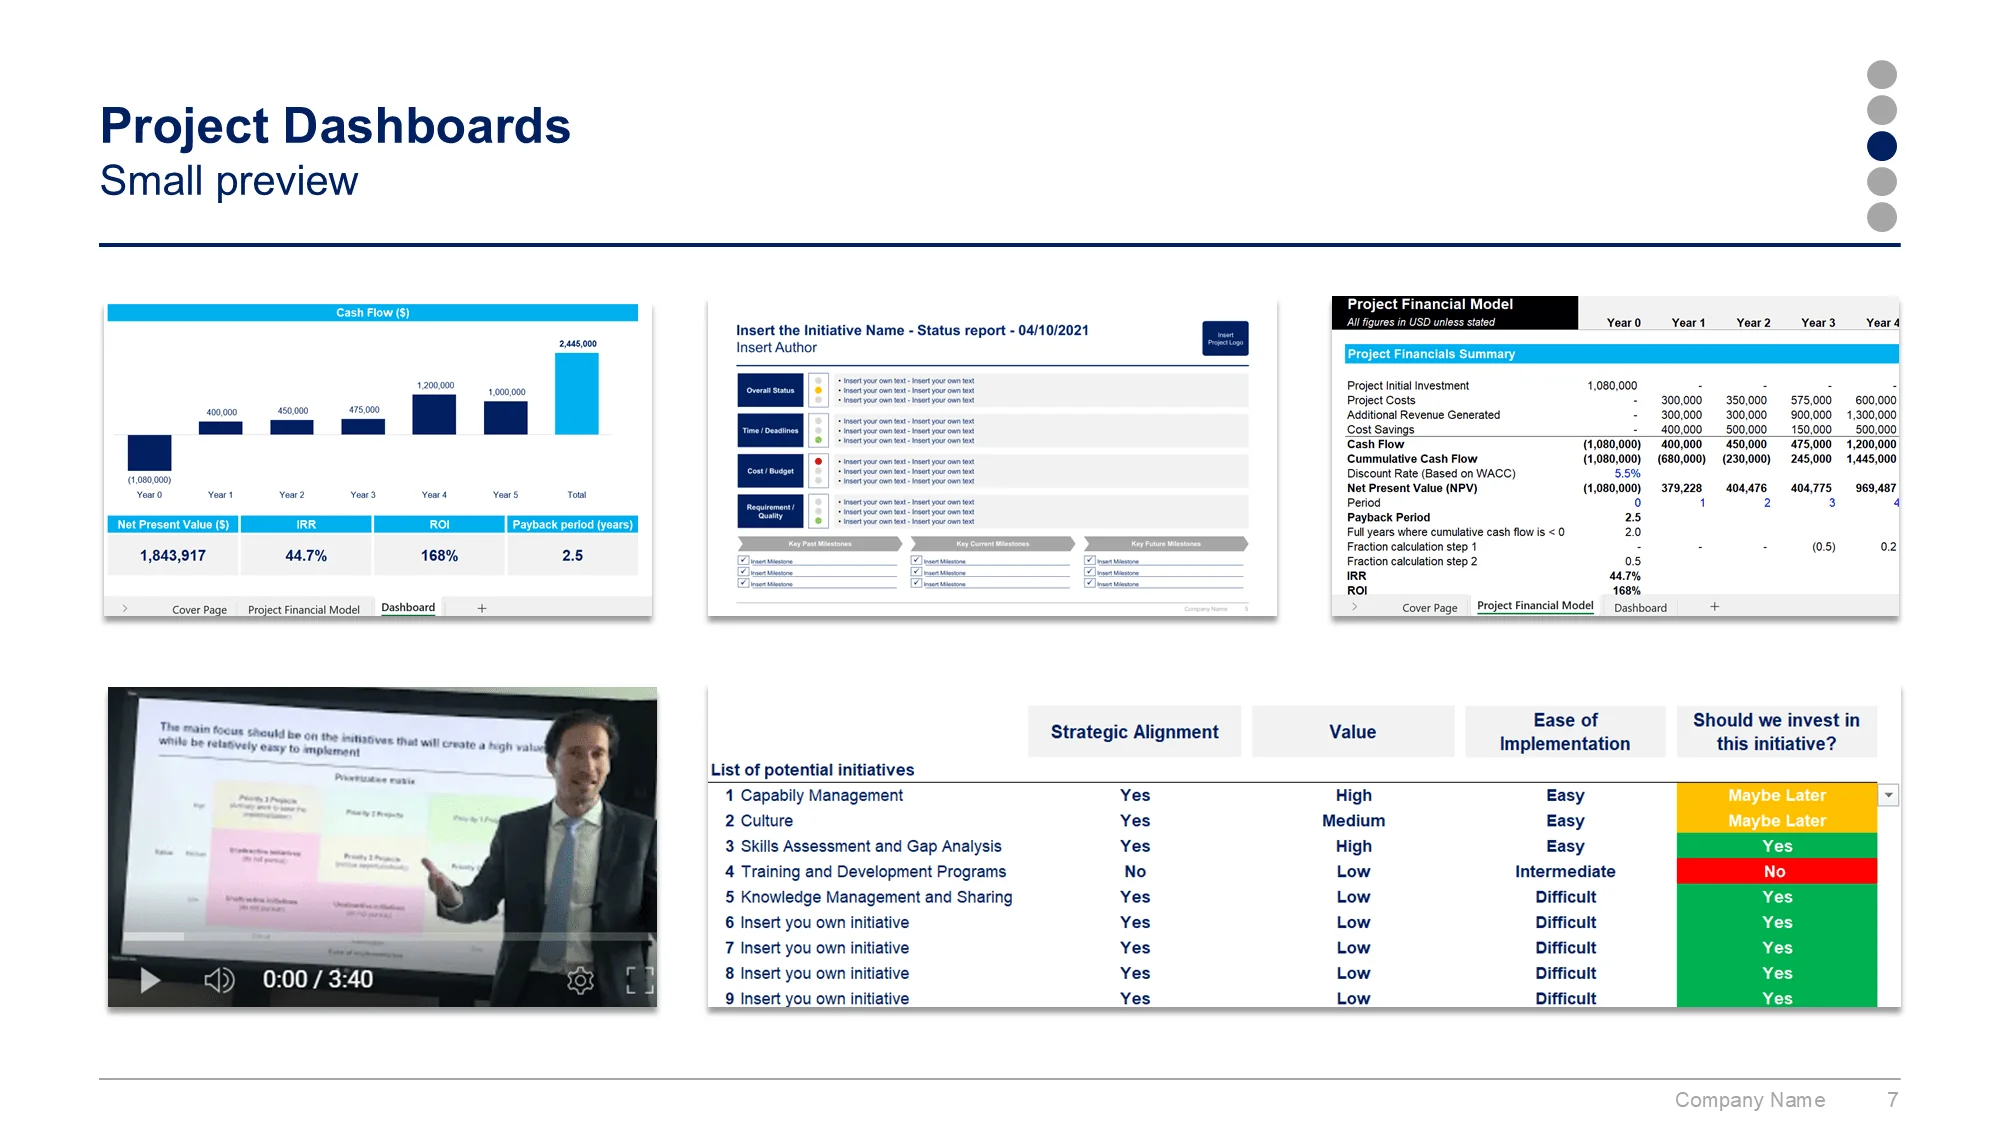
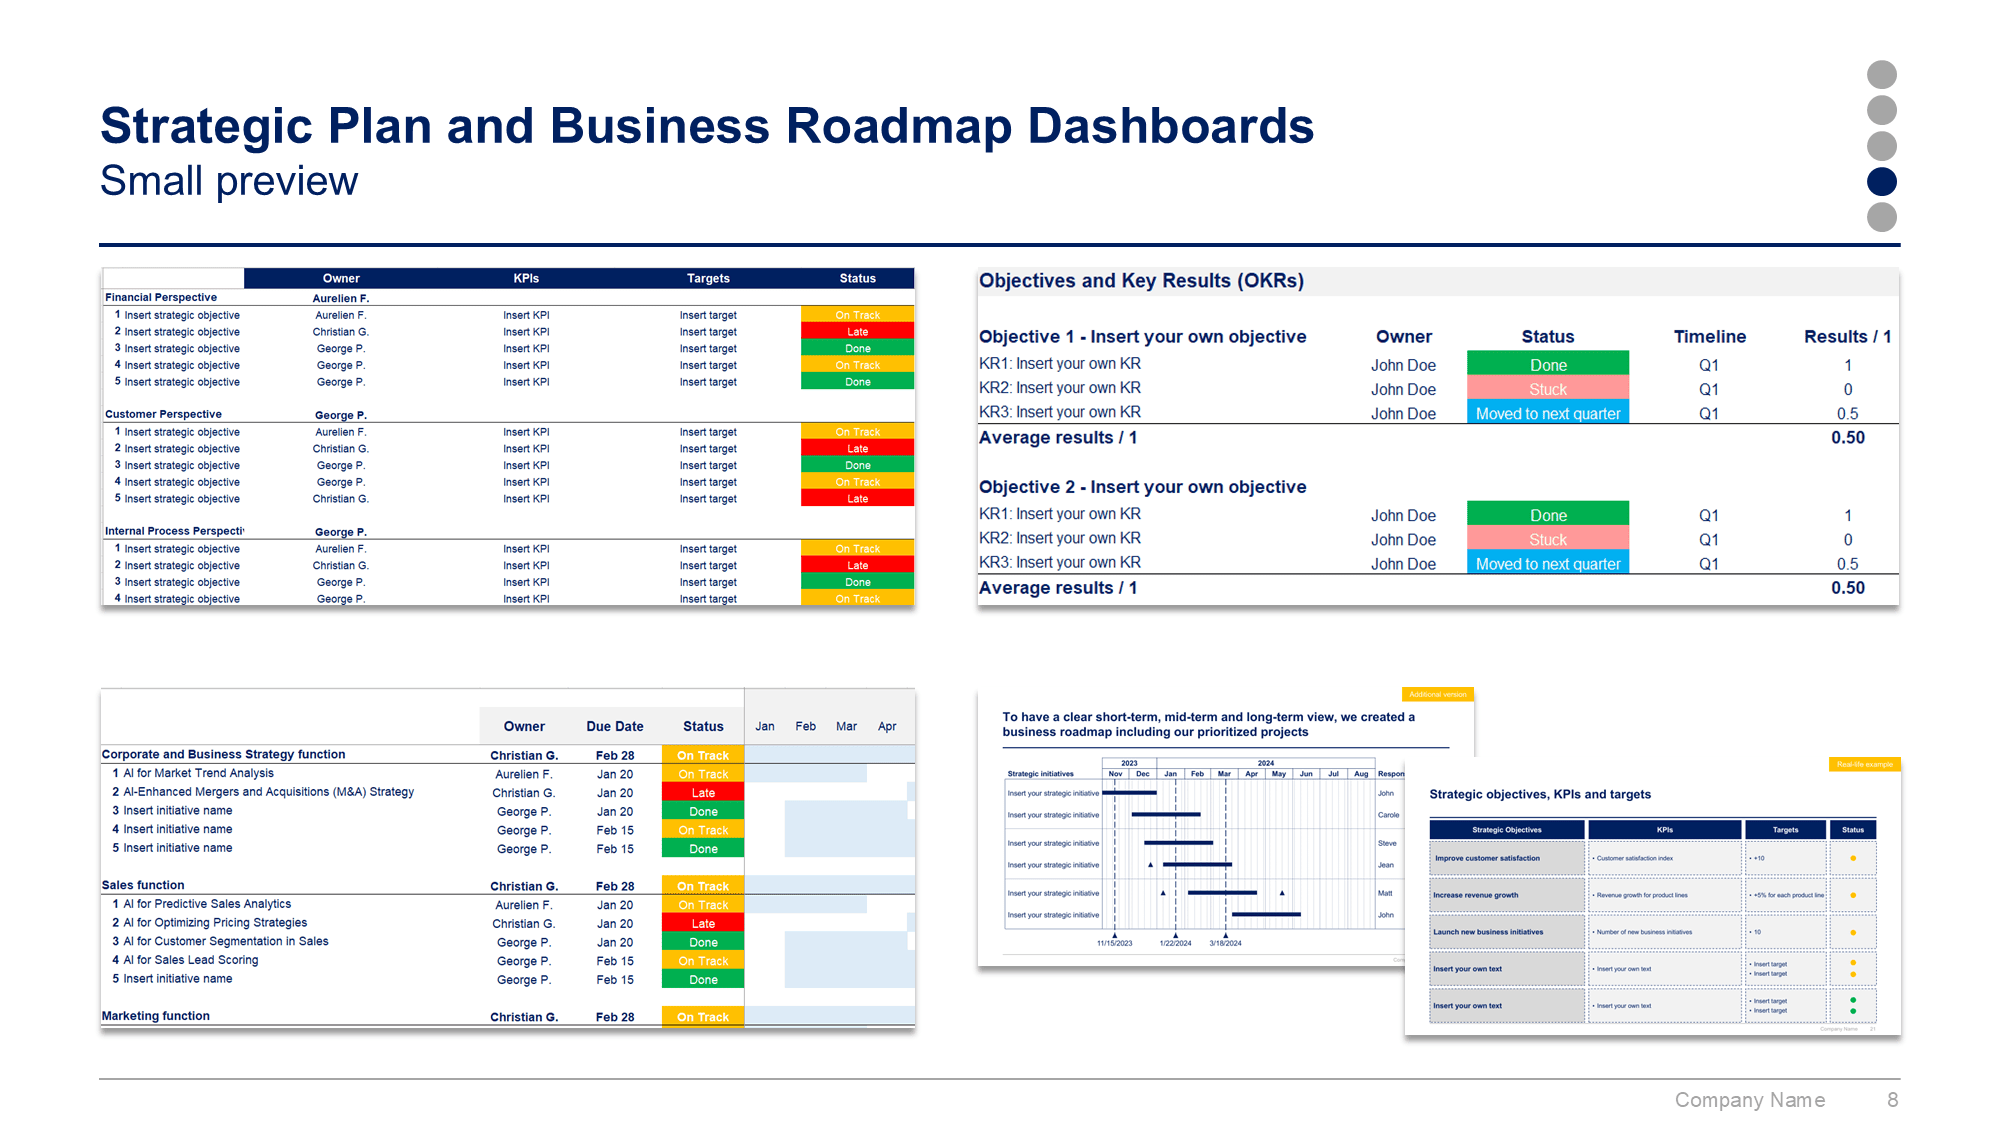
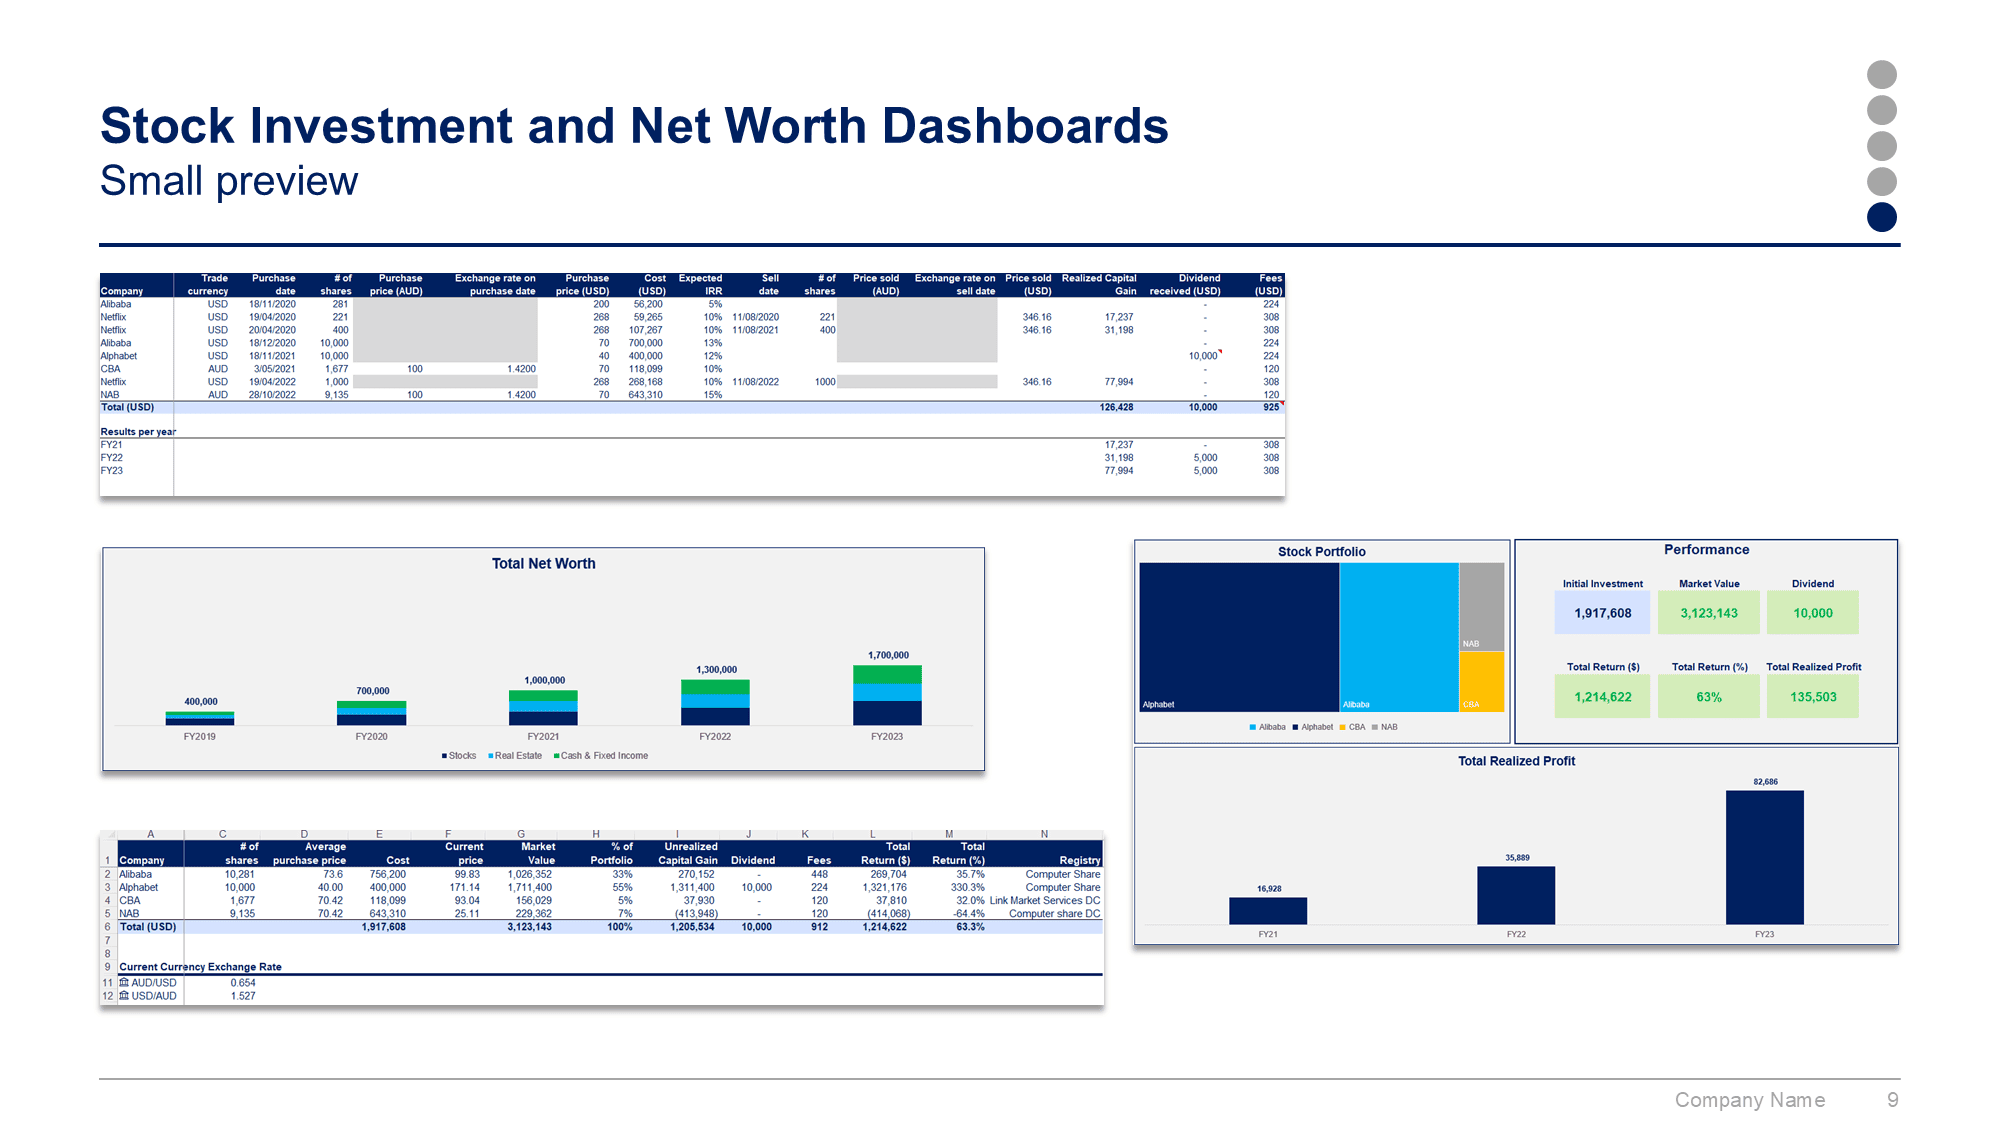
This Executive Dashboard Toolkit was created by ex-McKinsey, Deloitte & BCG Management Consultants, and JP Morgan Investment Bankers. It includes all the Excel and Powerpoint dashboards required to monitor and optimize the performance of any organization, function, team, investment portfolio or project, regardless of size. Spend few minutes copying and pasting your data, and watch as all the charts, graphs, financial models and tables update automatically.
- Monitor and optimize the performance of any organization, function, team, investment portfolio or project, regardless of size.
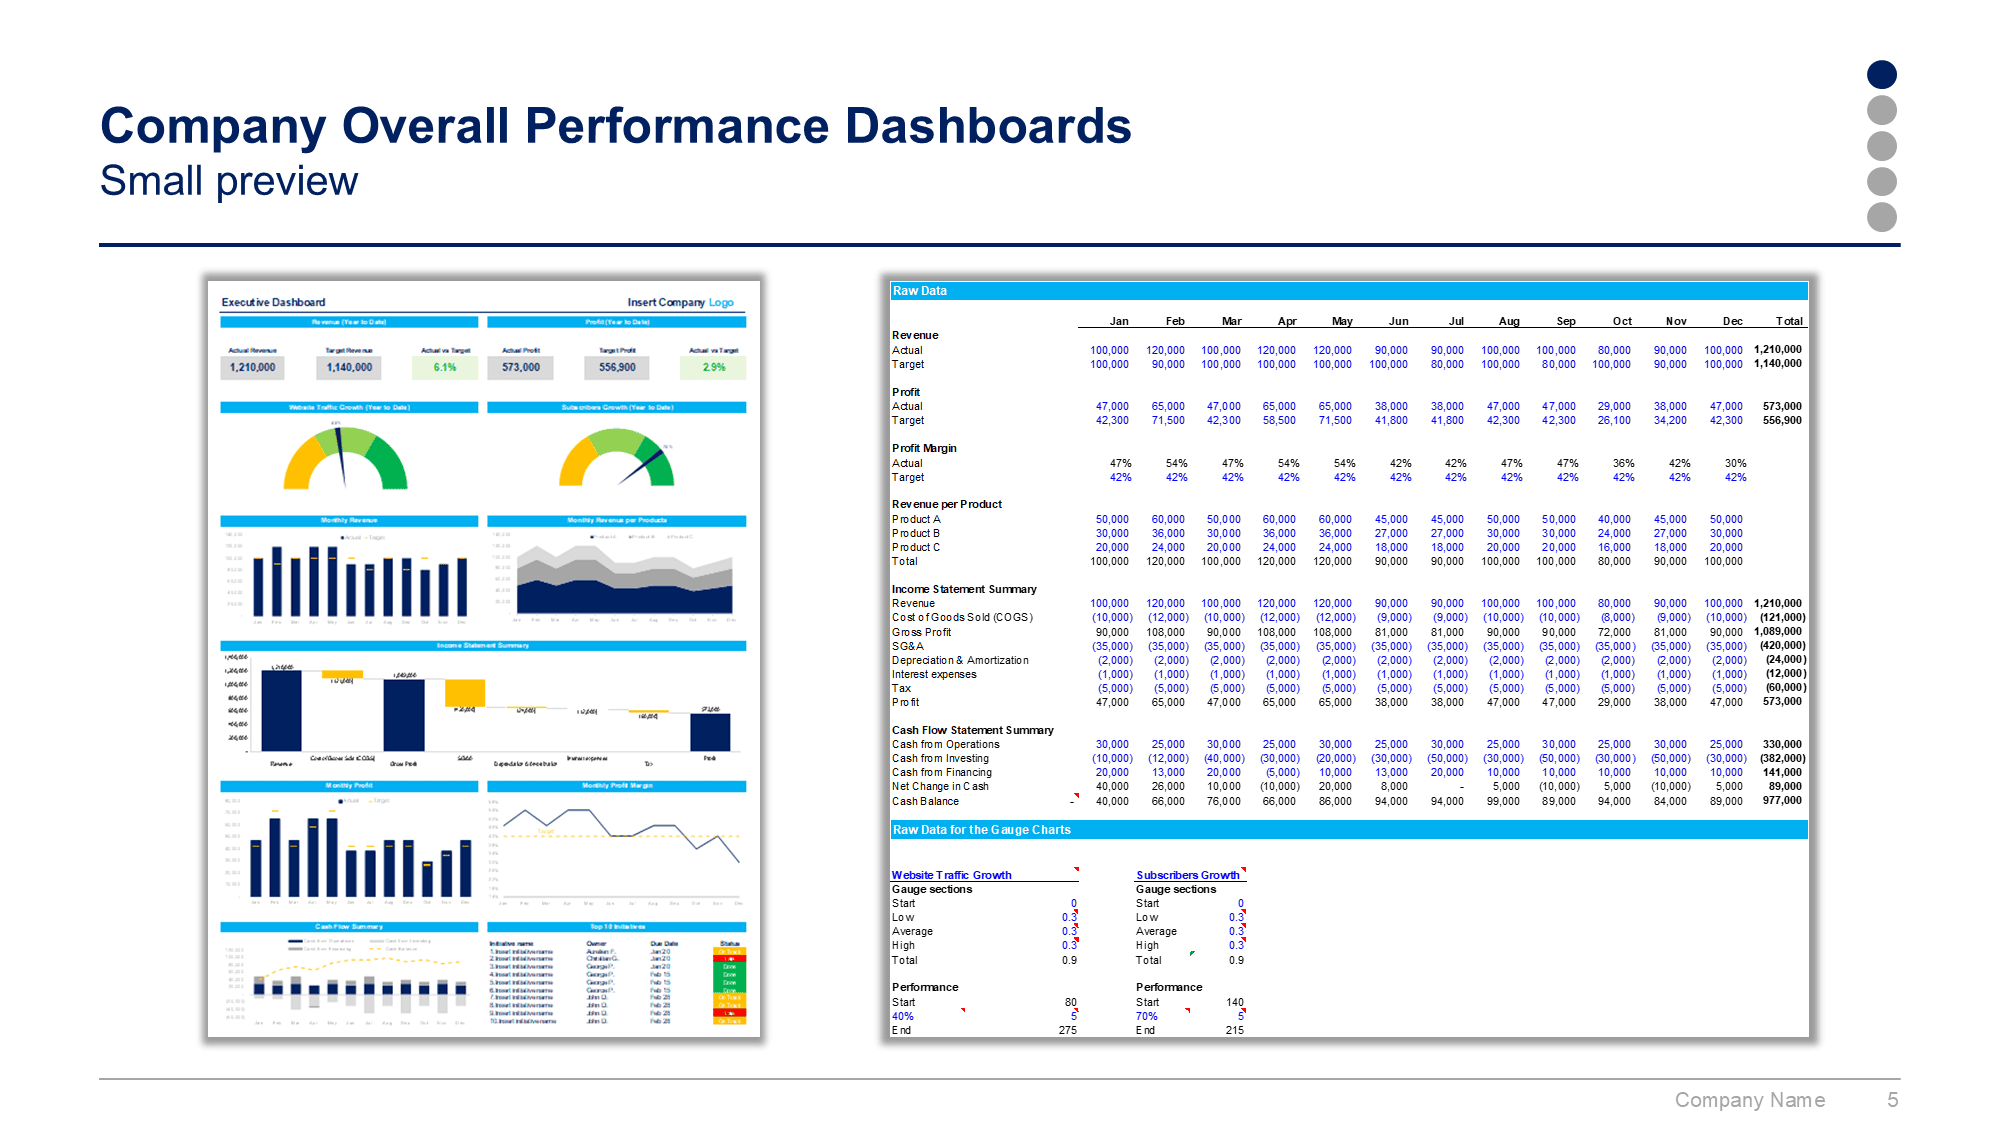
- Visualize your key performance indicators: revenue, profit, profit margin, product revenue, costs, cash flows, top initiatives status, etc.
- Customize the dashboards to include the key performance indicators specific to your organization.
- Present to your executive committee, board of directors, or potential investors world-class charts, visuals and financial models: Waterfall charts, Gauge charts, Combo charts merging 2 types of charts in one, conditional formatting with different colours based on performance, etc.
Details & Craftsmanship
Every detail has been carefully considered to bring you the perfect product.
Details & Craftsmanship
Every detail has been carefully considered to bring you the perfect product.
Details & Craftsmanship
Every detail has been carefully considered to bring you the perfect product.
Details & Craftsmanship
Every detail has been carefully considered to bring you the perfect product.
Details & Craftsmanship
Every detail has been carefully considered to bring you the perfect product.
Details & Craftsmanship
Every detail has been carefully considered to bring you the perfect product.
Details & Craftsmanship
Every detail has been carefully considered to bring you the perfect product.
Details & Craftsmanship
Every detail has been carefully considered to bring you the perfect product.
Details & Craftsmanship
Every detail has been carefully considered to bring you the perfect product.
Details & Craftsmanship
Every detail has been carefully considered to bring you the perfect product.
Details & Craftsmanship
Every detail has been carefully considered to bring you the perfect product.
Details & Craftsmanship
Every detail has been carefully considered to bring you the perfect product.
Details & Craftsmanship
Every detail has been carefully considered to bring you the perfect product.
Details & Craftsmanship
Every detail has been carefully considered to bring you the perfect product.
Details & Craftsmanship
Every detail has been carefully considered to bring you the perfect product.
Description
This Executive Dashboard Toolkit was created by ex-McKinsey, Deloitte & BCG Management Consultants, and JP Morgan Investment Bankers. It includes all the Excel and Powerpoint dashboards required to monitor and optimize the performance of any organization, function, team, investment portfolio or project, regardless of size. Spend few minutes copying and pasting your data, and watch as all the charts, graphs, financial models and tables update automatically.
- Monitor and optimize the performance of any organization, function, team, investment portfolio or project, regardless of size.
- Visualize your key performance indicators: revenue, profit, profit margin, product revenue, costs, cash flows, top initiatives status, etc.
- Customize the dashboards to include the key performance indicators specific to your organization.
- Present to your executive committee, board of directors, or potential investors world-class charts, visuals and financial models: Waterfall charts, Gauge charts, Combo charts merging 2 types of charts in one, conditional formatting with different colours based on performance, etc.